
War or technology: the summer’s BIS–IMF diptych, read with method
A didactic reading of the IMF’s July WEO Update, in continuity with the BIS Annual Report: what the document says, what our analysis adds, and the four questions we always ask.

In 30 seconds
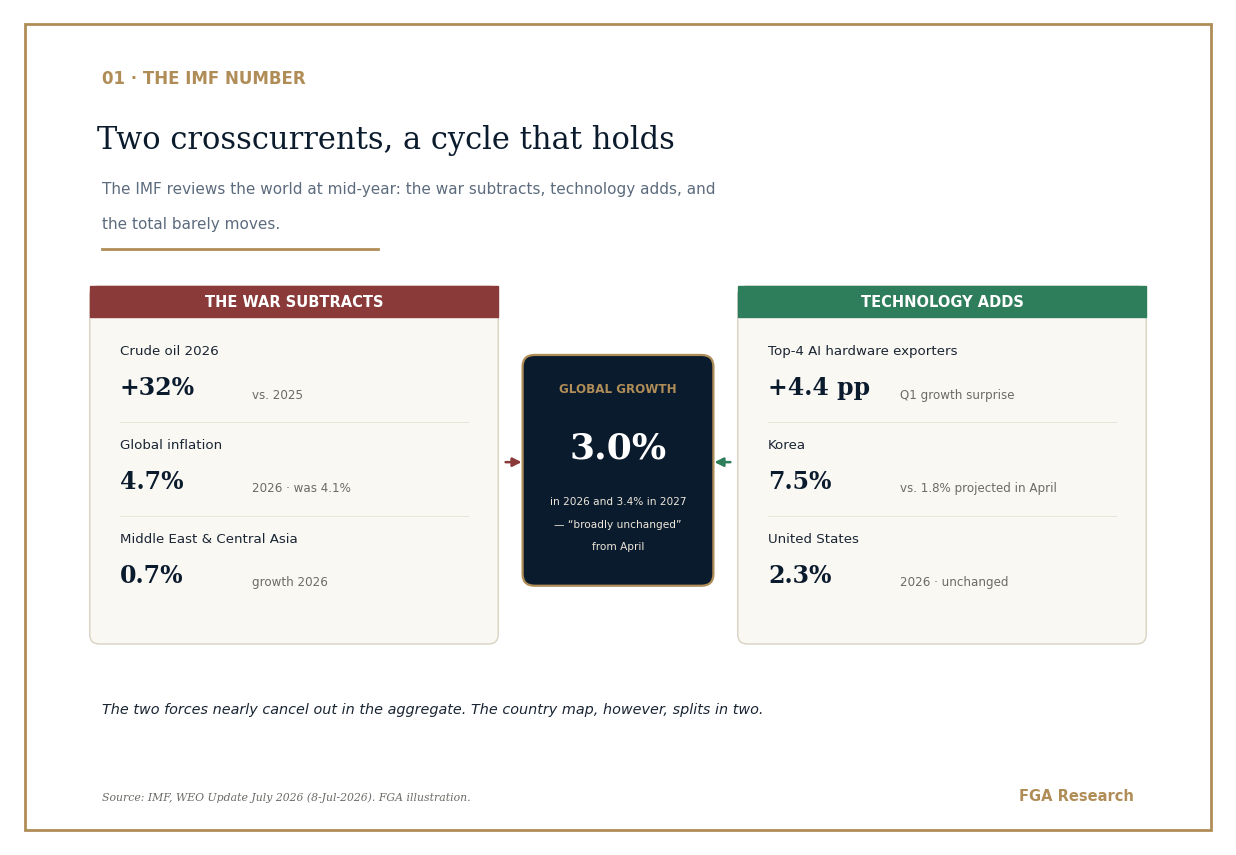
Two giant shocks nearly cancel out. The world grows 3.0% in 2026 and 3.4% in 2027, “practically unchanged” from April. But the aggregate hides a world split in two: whoever is plugged into the technology cycle grows; whoever pays the energy bill does not.
Technology is now the leg holding up the cycle — the same one the BIS flagged two weeks ago as a financial-stability risk. Both things are true at once, and that coexistence is the story of the summer.
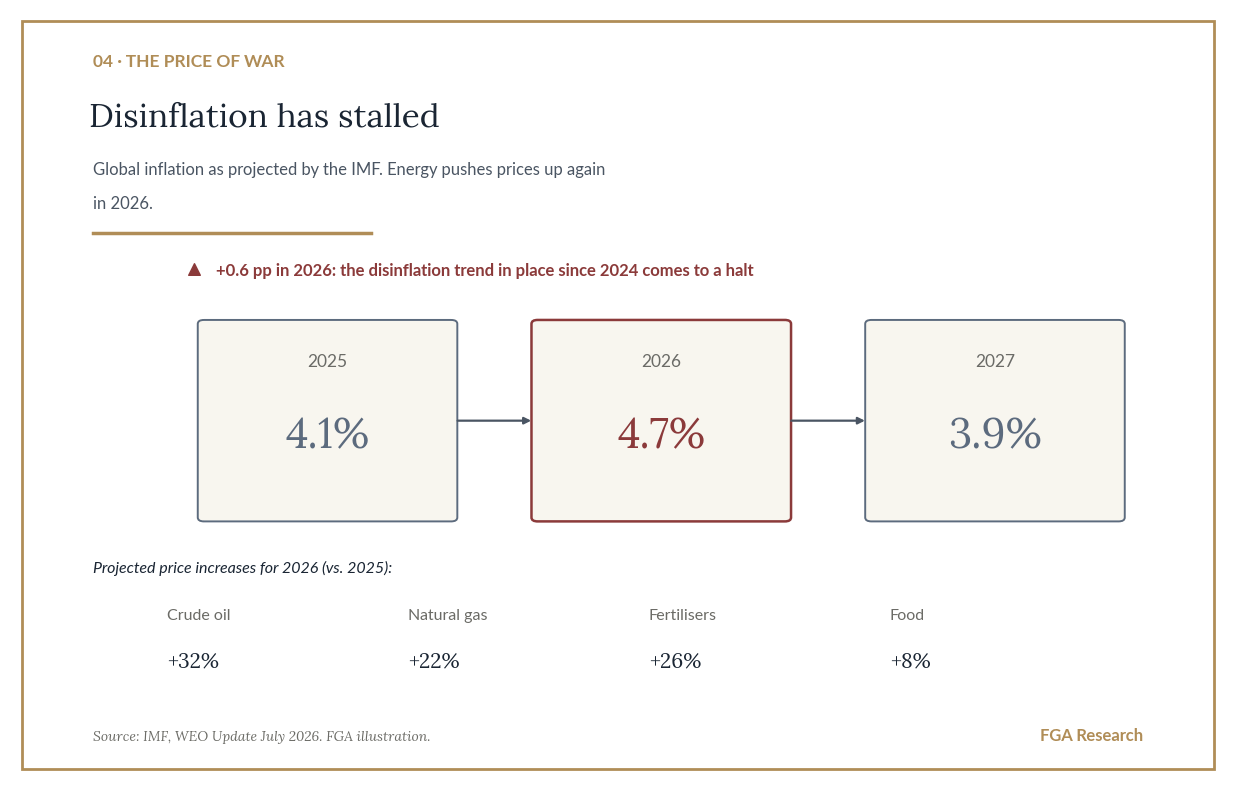
The visible cost of the war is in prices, not in growth. Global inflation rises from 4.1% to 4.7% in 2026: the disinflation under way since 2024 has stalled.
Our 4-layer model keeps the regime at compressed spring, unchanged. No layer turns with this document: it is context that confirms, not a turning point. State and regime, not a signal.
The document, in context
On June 28, the BIS —the central bank of central banks— put numbers on the AI boom in its Annual Report. We analysed it here: more than $1 trillion of capex in 2025-26, financed increasingly with debt, with circular financing as the real focus of risk.
On July 8, the IMF published the other side of the argument. Its mid-year revision carries a title that is already a thesis: “Global Economy in Crosscurrents of War and Technology”.
This piece does three things: it summarises the essentials of the document, connects it with the BIS warning, and applies our four-layer methodology to it. With direct access to the primary sources at the end.
What the WEO says, in five points
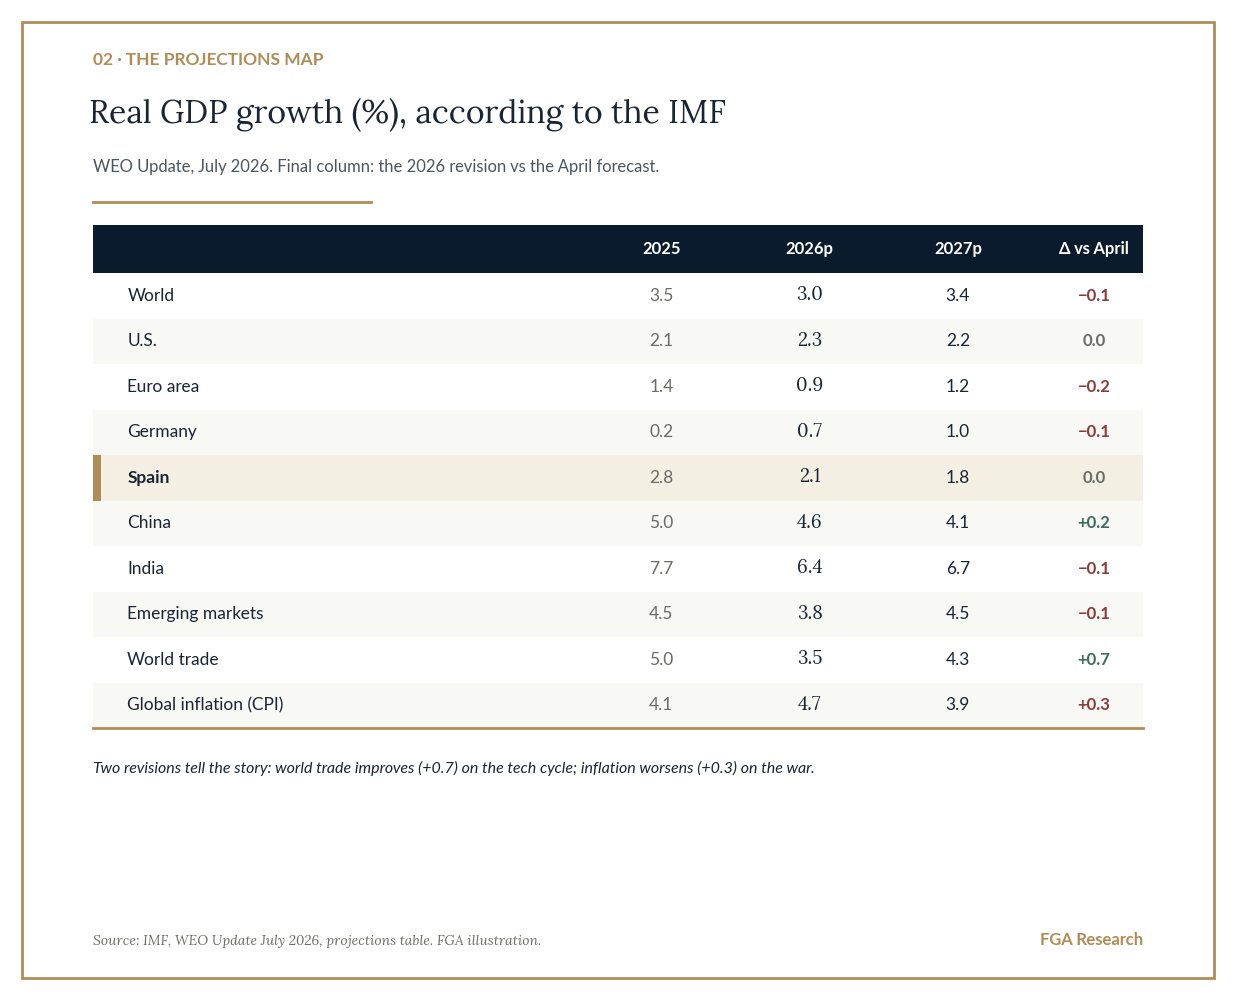
Global growth barely moves: 3.0% in 2026 and 3.4% in 2027. It comes from a 3.5% average in 2024-25. Two enormous shocks, almost a draw in the aggregate.
Two opposing currents. The war in the Middle East subtracts (a supply shock, energy roughly 25% above pre-war levels); the AI-linked technology cycle adds. Each country’s impact depends on its exposure to one and its position in the other.
The map splits in two. The four big AI-hardware exporters (Korea, Taiwan, Thailand, Malaysia) surprised to the upside by +4.4 points on average in the first quarter; the rest of the world, by −0.3. Korea grew at 7.5% when 1.8% was projected. Meanwhile, the Middle East and Central Asia slow to 0.7% in 2026 on the closure of the Strait of Hormuz.
Disinflation has stalled. Global inflation rises from 4.1% to 4.7% in 2026 before easing to 3.9% in 2027. World trade slows from 5.0% to 3.5% this year.
Risks more balanced than in April, but still to the downside. Re-escalation in the Middle East, trade fragmentation and — in the IMF’s own words — AI hype and exuberant markets that “could sow the seeds of macrofinancial instability”.
The continuity with the BIS: two halves of one story
Here is the fascinating part. The BIS and the IMF look at the same engine — AI capex — and each tells one half.
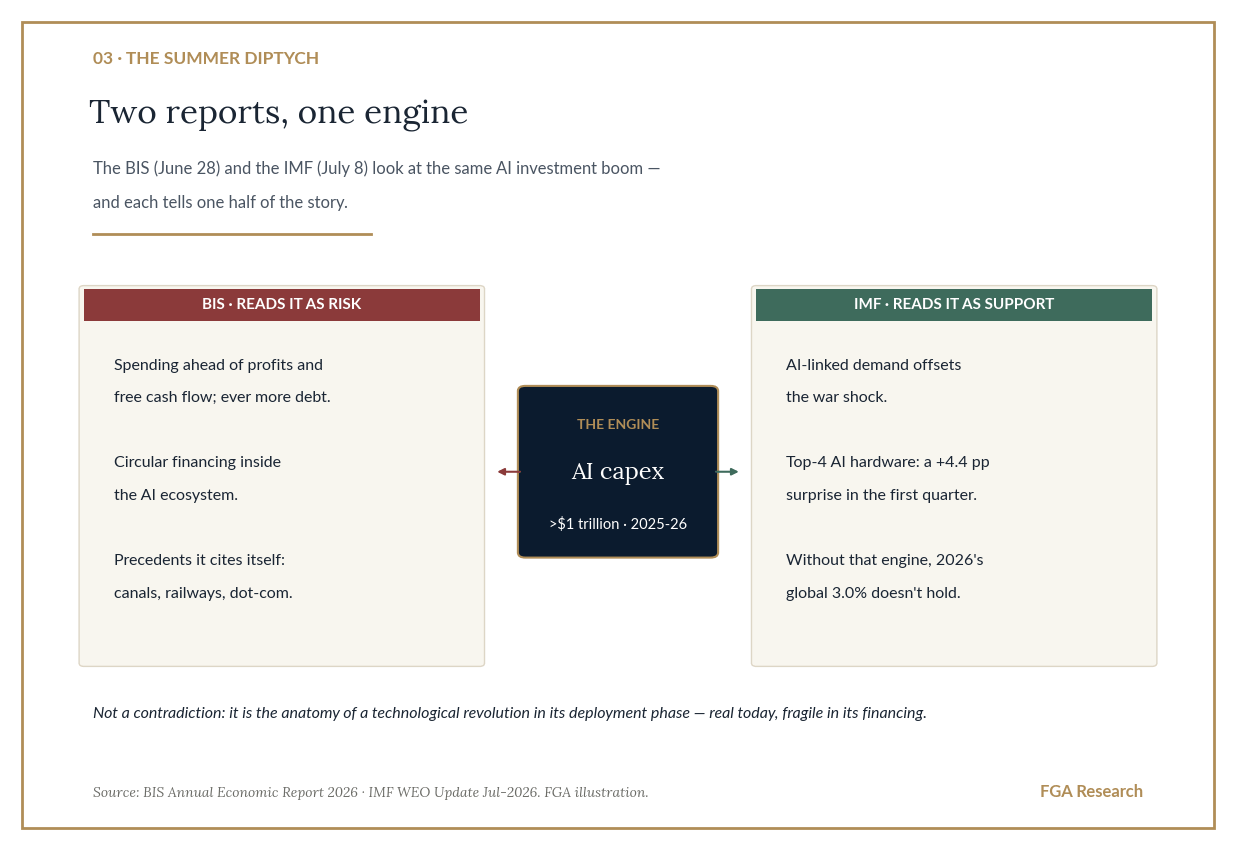
Kindleberger would have smiled. The great technological revolutions —canals, railways, electricity, the internet— were real in the economy and fragile in their financing, at the same time. The BIS speaks of tomorrow’s financial fragility; the IMF, of today’s real economy. That both are true at the same time is not an anomaly: it is the historical norm of the deployment phase. And that is why neither reading, on its own, is enough to classify the cycle.
The price of war: disinflation stops
The most visible cost of the war shock is not in growth — it is in prices. The IMF projects the average barrel at $89 for 2026 (9% above what was assumed in April) and revises global inflation upwards.
A nuance the document itself underlines: the global economy’s resilience rests in part on oil inventories that are “approaching multi-year lows”. A cushion that is spent by using it. And the fine print of inflation matters: core inflation returns to target only gradually — by mid-2027 in the United Kingdom, by late 2027 in the US and Japan, and not before 2028 in the euro area.
Our methodology, applied to the document
Every time an institution publishes a flagship report, we ask it the same four questions. It is not a ritual: it is the discipline that keeps a strong headline from being mistaken for a change of cycle.
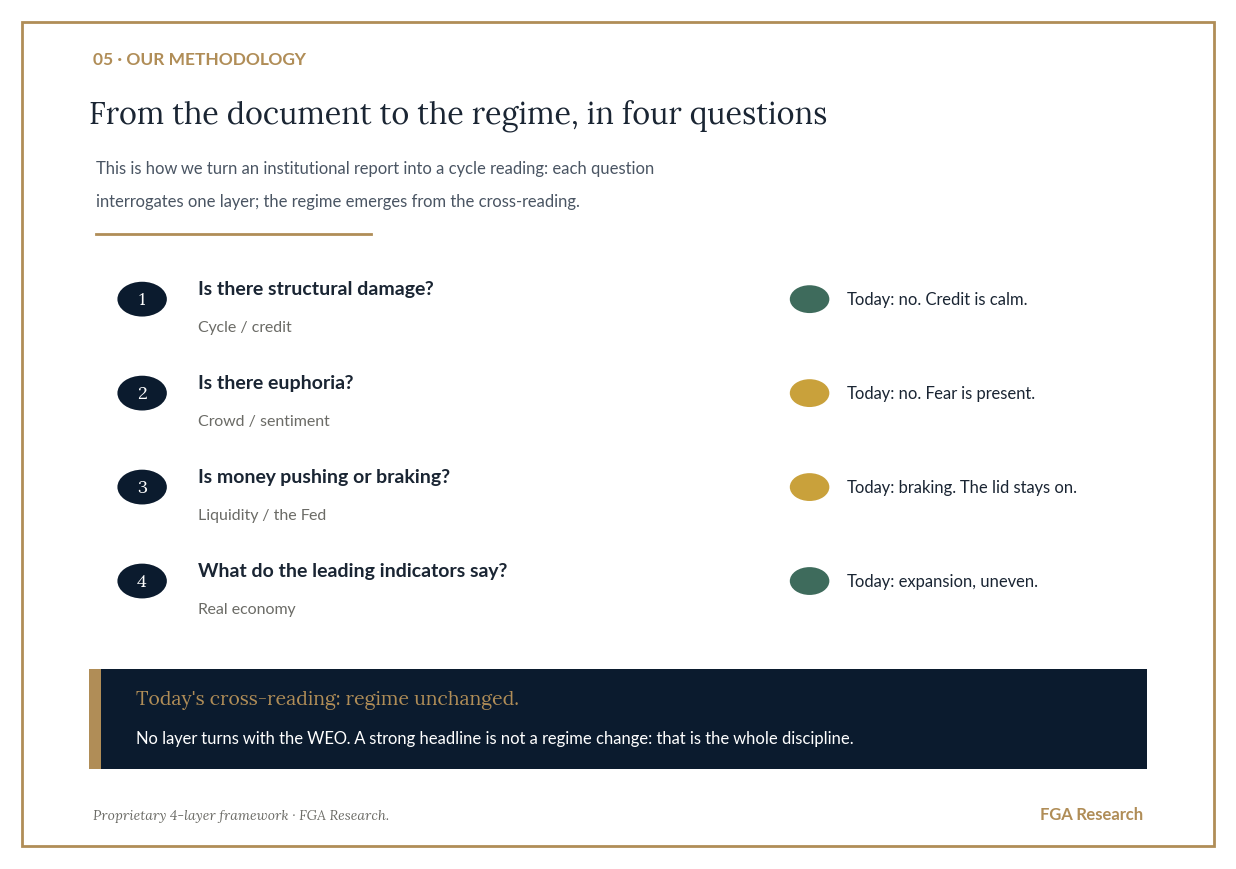
The result, at a glance:
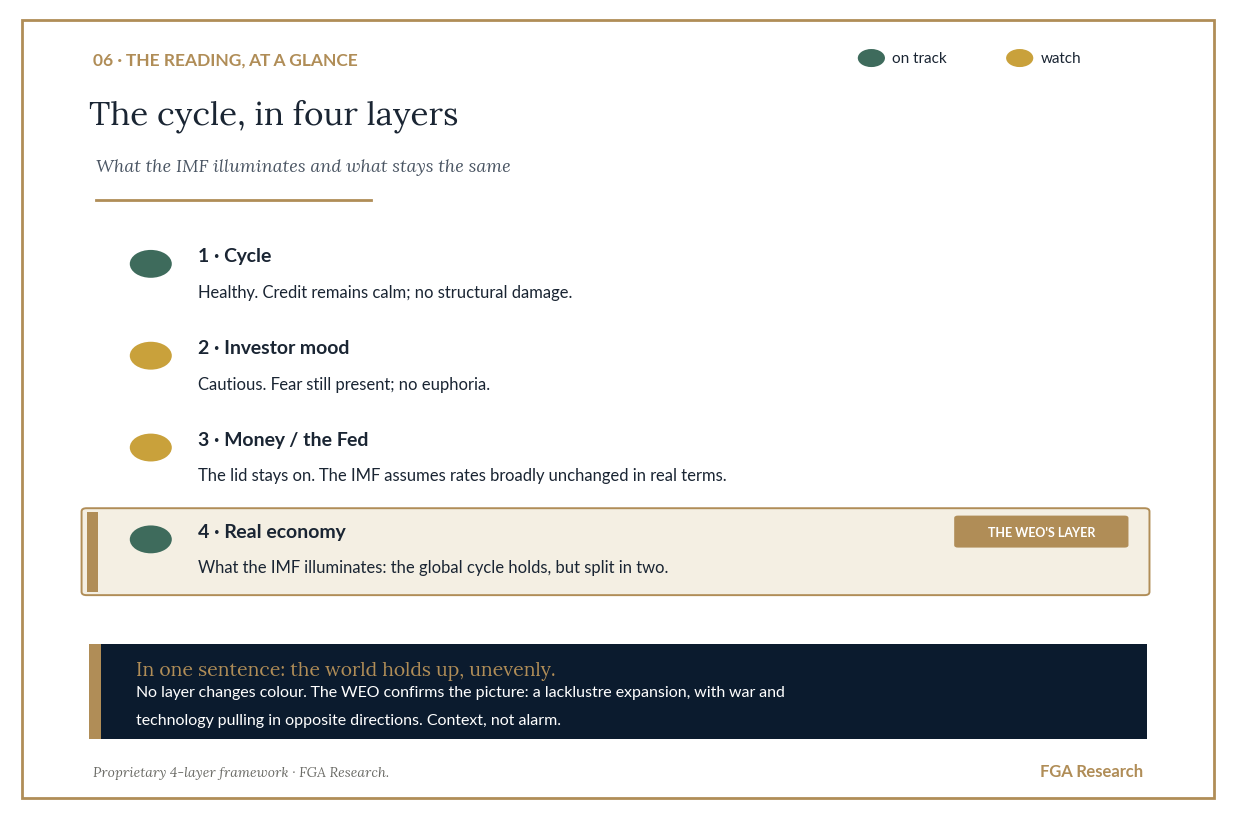
Today’s panel reading: the cycle, out of the alert zone; the crowd, fearful despite the indices; liquidity, braking — the lid stays on, as the Fed left written in its June minutes; and the real economy, in an uneven expansion. The regime is still compressed spring: energy stored under a lid. An expansion that holds with less margin for error — inflation that stops falling, inventories being run down, and a cycle increasingly resting on a single leg: technology.
The case in favour (because it must be argued too)
The IMF itself lists the upside risks, and they deserve to be taken seriously: a faster-than-assumed normalisation of energy markets (the reopening of the strait begins in mid-July in its baseline), even stronger technology investment that keeps pulling activity along, a revival of trade cooperation that lowers barriers, and structural reforms that lift medium-term growth. If several of those pieces fall into place, 2026’s 3.0% would prove too low. The BIS–IMF diptych is not a prophecy of collapse: it is a map of what the cycle is sensitive to, in every direction.
What to watch in the coming months
The technology leg. If AI capex cooled while energy stays expensive, the two currents would stop cancelling each other out. It is the scenario that links the BIS warning with the IMF map. (Layers 1 and 4.)
Oil inventories. Near multi-year lows: if the strait’s reopening is delayed, the adjustment would pass to prices, with non-linear dynamics. (Layers 3 and 4.)
Inflation expectations for 2027. So far they have barely moved — that is where it is decided whether the shock is transitory or becomes entrenched, and whether the liquidity lid tightens further. (Layer 3.)
None of them predicts a date. All of them move the regime. We track them every week.
Access to the documents
Always the primary source, not the headline:
IMF · WEO Update July 2026 — official page · full report (PDF)
BIS · Annual Economic Report 2026 — official page · and our layer-by-layer reading of the BIS report
What is a market regime — the framework with which we read all of the above
An informational document by FGA Research. It does not constitute investment advice, a personalised recommendation, or a buy/sell signal. References to the IMF and the BIS are provided for educational purposes; the figures come from the sources cited. Past results —real or simulated— do not guarantee future results; investing involves risk, including the total loss of capital.
Independence. Capital. Conviction. · FGA Research & Advisory · Est. 2006 · 33 years of study