

In 30 seconds
It is not "revolution or bubble": it is both. Like the railway or the internet, AI is a real transformation and, at once, an episode with a bubble profile.
What decides the outcome is productivity, not the technology. Task-level gains are real (20–50%); the aggregate kind —the one that pays for the capex— is still below 1%.
The main risk is not valuations: it is the financing —with debt, opaque and circular.
The BIS warns, it does not predict. And our 4-layer model places the regime today in a compressed spring: stored tension under a lid, no damage yet.
This is how we read the cycle every week: four layers, made clear. Get it free in your inbox.
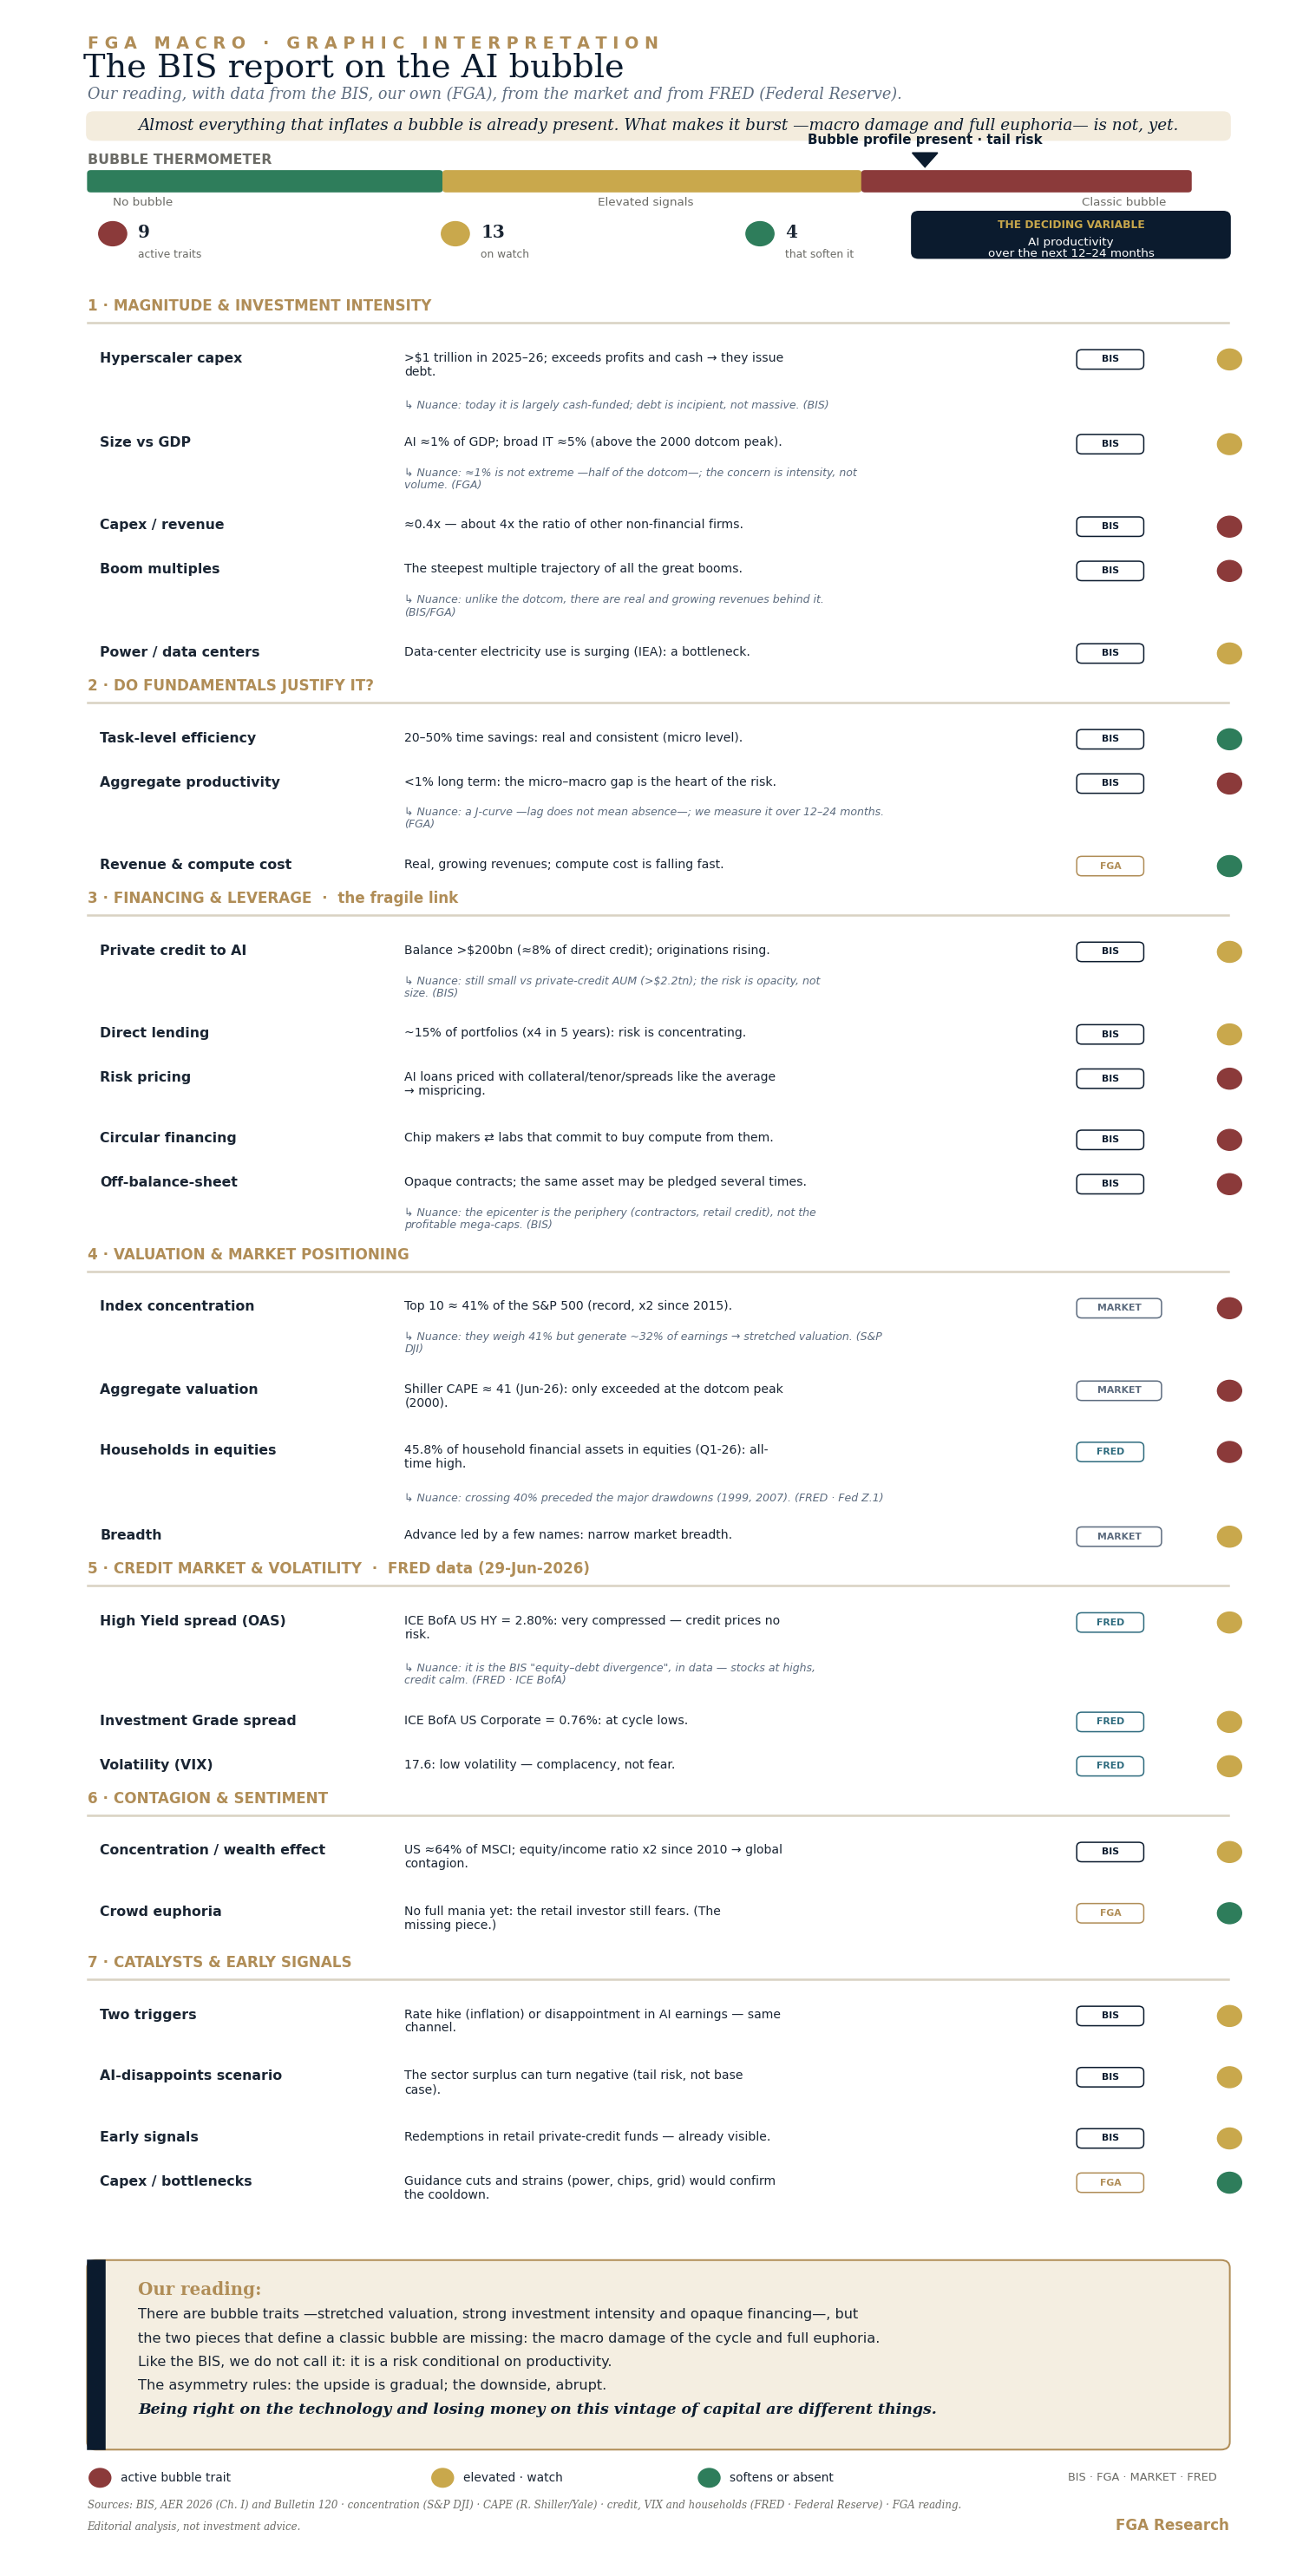
The BIS report, in brief
On 28 June the BIS —the central bank of central banks— published its Annual Economic Report; the chapter is titled "Progress and peril". In one line: AI has sustained growth, but its financing is creating risks. What the BIS states, plainly:
The five largest hyperscalers will spend over a trillion dollars on AI capex in 2025–26, beyond their earnings and free cash flow; some are already issuing debt.
AI-specific investment is around 1% of GDP; broad IT investment, about 5% —above the dot-com peak of 2000.
Task-level efficiency rises 20–50%, but aggregate productivity is estimated below 1% over the long run.
The BIS recalls the precedents —canal (1830s), railway (1840s), electrification (1920s), dot-com (90s)— and places the current multiple trajectory as the steepest of all.
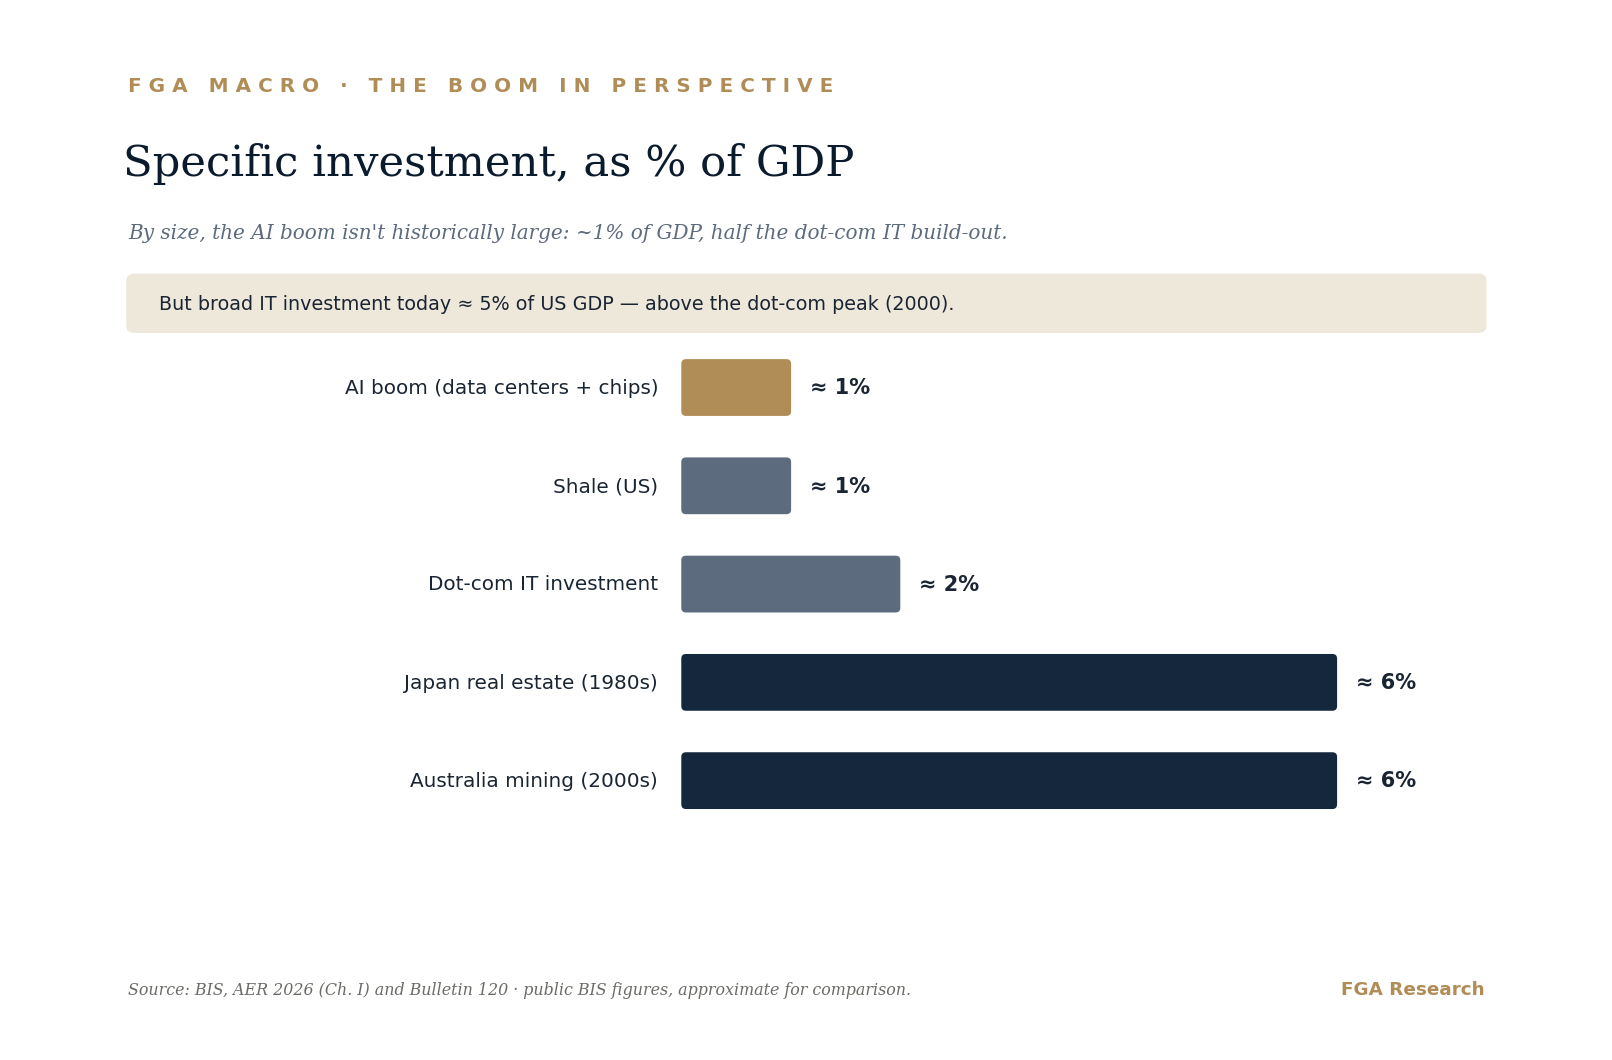
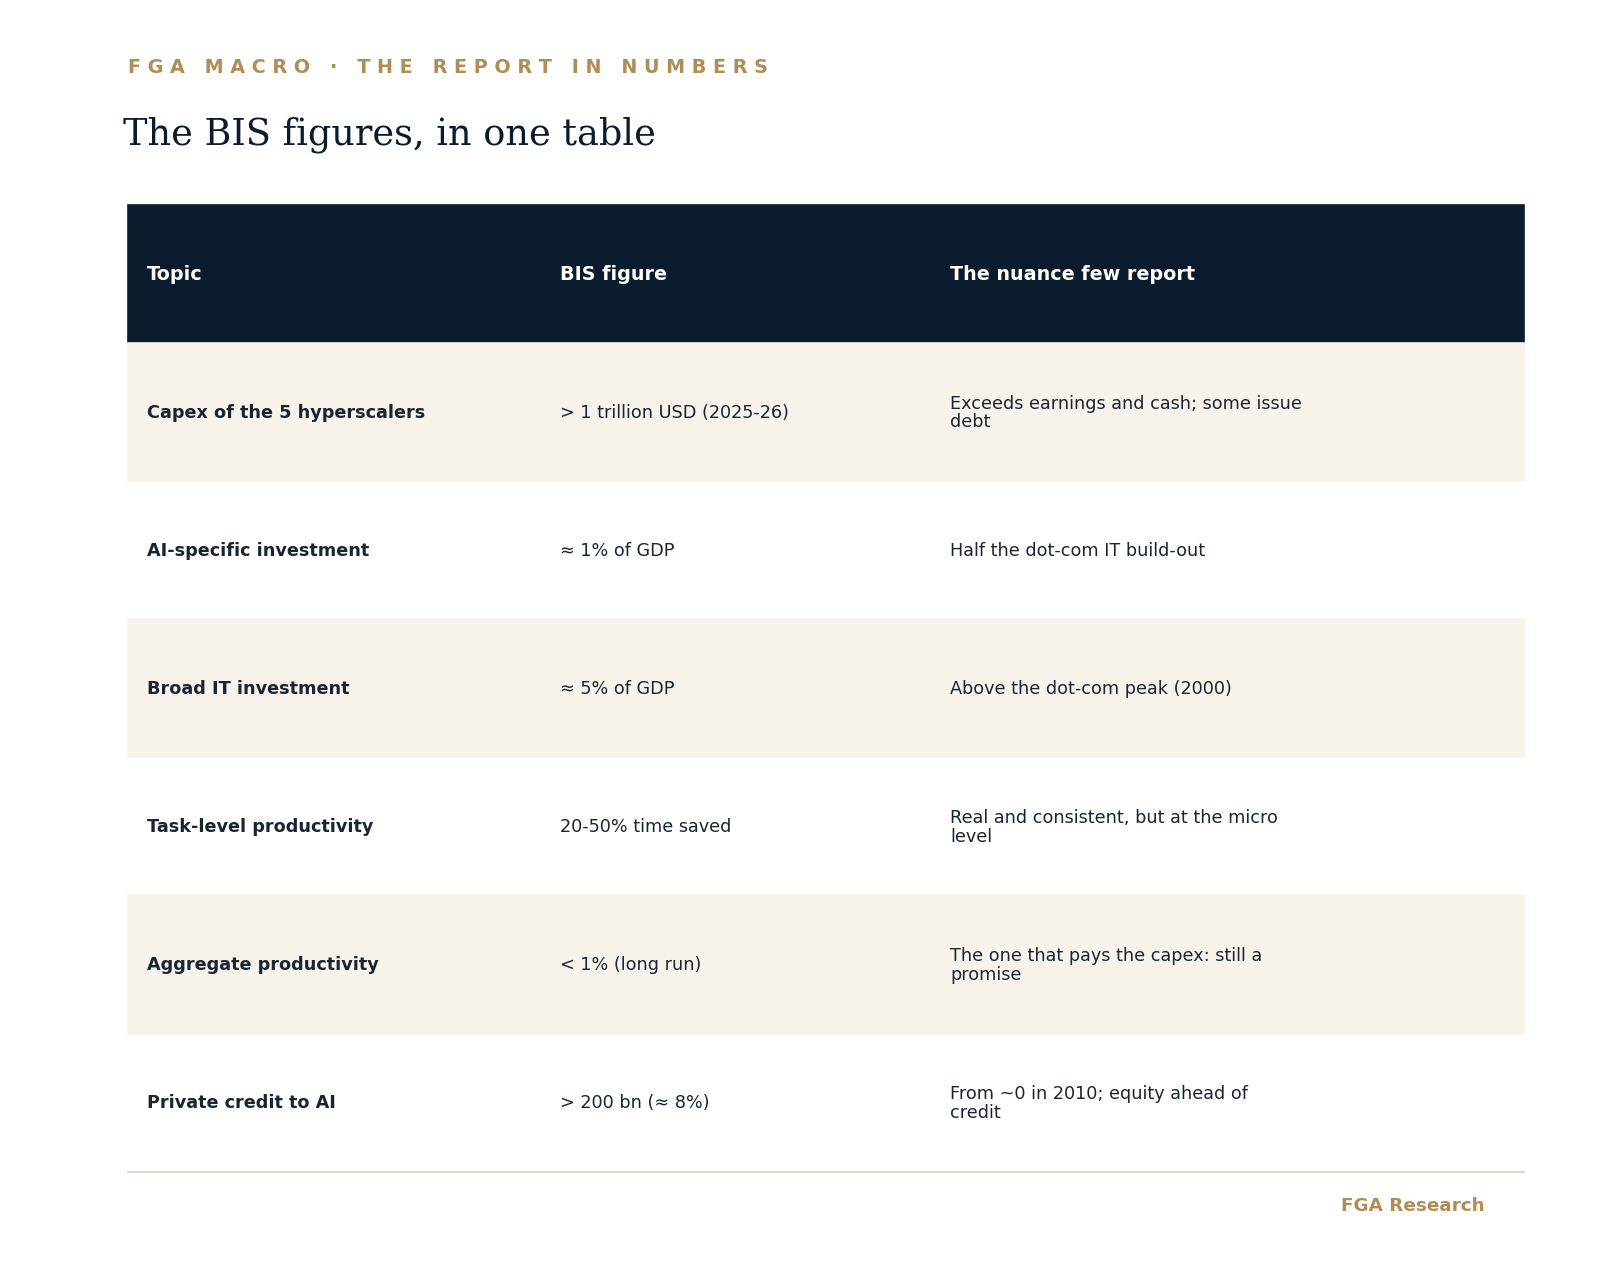
The BIS’s own conclusion is nuanced: it does not declare a bubble; it warns of a risk conditional on very high expectations being met. So much for the X-ray. From here, our reading.
Our reading: why revolution and bubble coexist
The framing error is to pose it as a dilemma: either a revolution or a bubble. Economic history says it is almost always both, in this order.
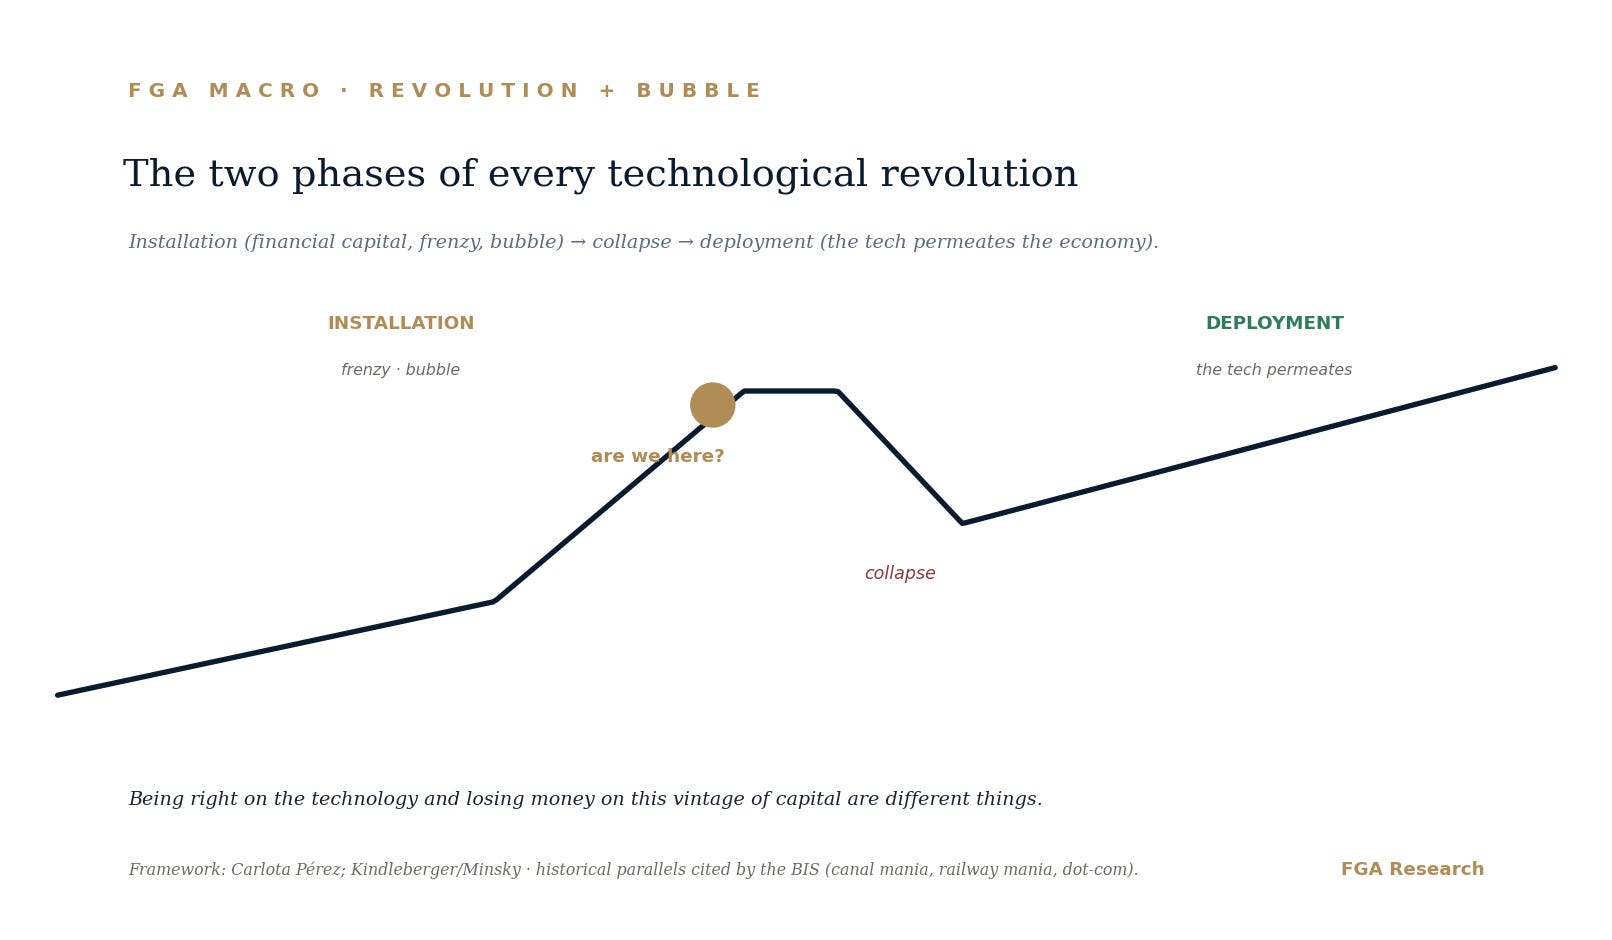
Kindleberger and Minsky described the anatomy of every bubble decades ago: a displacement (a real novelty) attracts capital; capital leverages up; price decouples from fundamentals; tension builds; and, finally, the reversal. Minsky’s mechanics are exactly what the BIS describes today: agents move from funding with their own cash to funding with debt.
Carlota Pérez put it clearly: every technological revolution has an installation phase —when financial capital builds the infrastructure, with frenzy and bubbles— and a deployment phase, when the technology permeates the real economy. Between them there is usually a collapse. The bubble does not contradict the revolution: it is how capital finances, in excess, its own infrastructure.
The railway is the best mirror. The network was built and transformed the world for decades. And even so, most first-wave investors lost money, because capital was destroyed before returns matured. Being right about the technology and losing money on this vintage of capital are two different things.
The four layers: from an unanswerable question to four with answers
Here is our value. The BIS gives the global X-ray once a year. We read the cycle layer by layer, every week. And the BIS report, without meaning to, feeds our four layers.
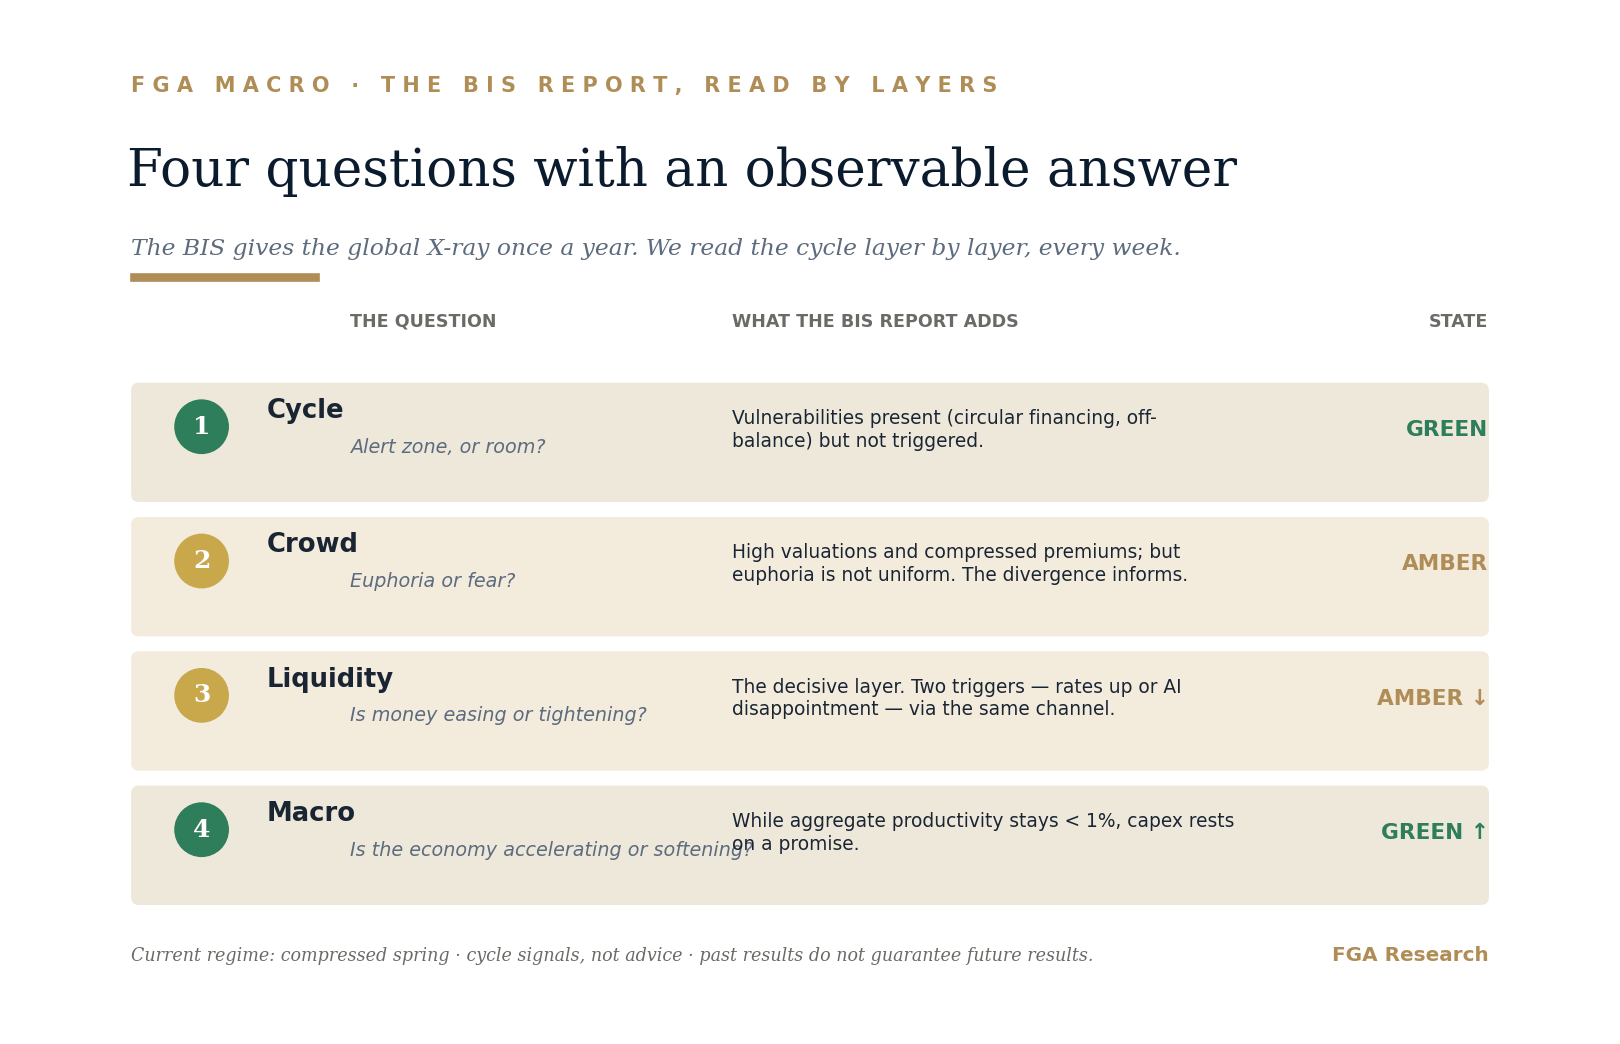
Layer 1 · Warning. Is the system in the alert zone or with room? The BIS describes vulnerabilities present —circular financing, off-balance-sheet risk— but not triggered. There is latent tension, not damage.
Layer 2 · Crowd. Euphoria or fear? Implied valuations are well above their historical benchmarks and risk premia are compressed. But euphoria is not uniform: you can buy the index and fear it at once. That divergence is information, not noise.
Layer 3 · Money (the Fed). Is money easing or tightening? It is the decisive layer. Bubbles burst when credit gets dearer, not when the technology disappoints. The BIS puts it another way: there are two independent triggers —a rate hike to contain inflation, or a disappointment in AI earnings— and both pass through the same financial channel.
Layer 4 · Macro. Is the underlying economy accelerating or softening? Here it connects with productivity: while the aggregate stays below 1%, capex rests on a promise, not a result.
The four layers turn an unanswerable question —"is it a bubble?"— into four questions with an observable answer. They do not predict the date. They locate the regime.
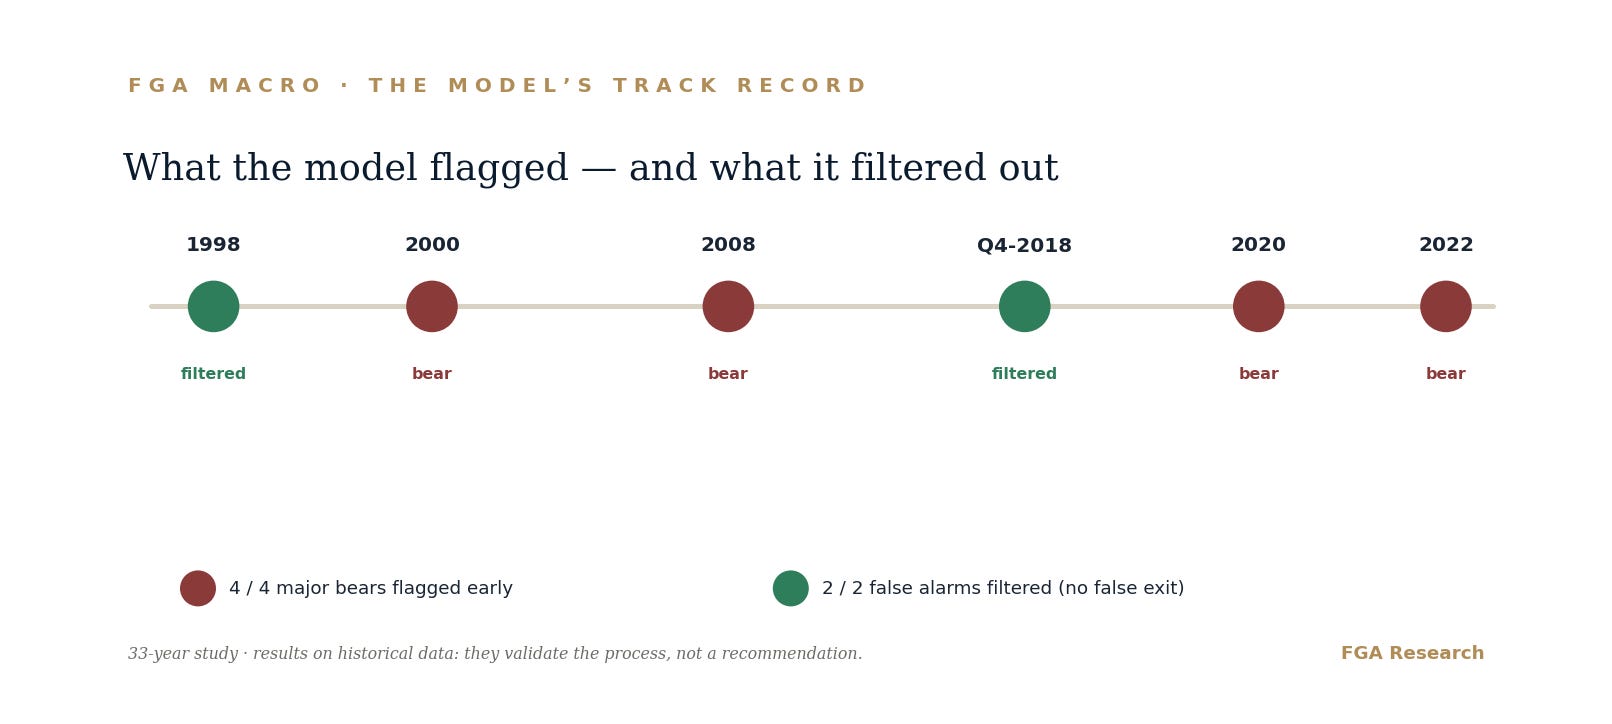
And it bears saying without false modesty: our model is not theory. Over the 33-year study, the four big structural declines —2000, 2008, 2020 and 2022— were characterised ahead of time, and the two corrections that led nowhere —1998 and Q4 2018— were filtered out without taking anyone out of the market falsely.
The real focus of risk: the financing
If you remember only one idea from the report, let it be this: the problem is not valuations, it is the financial plumbing.
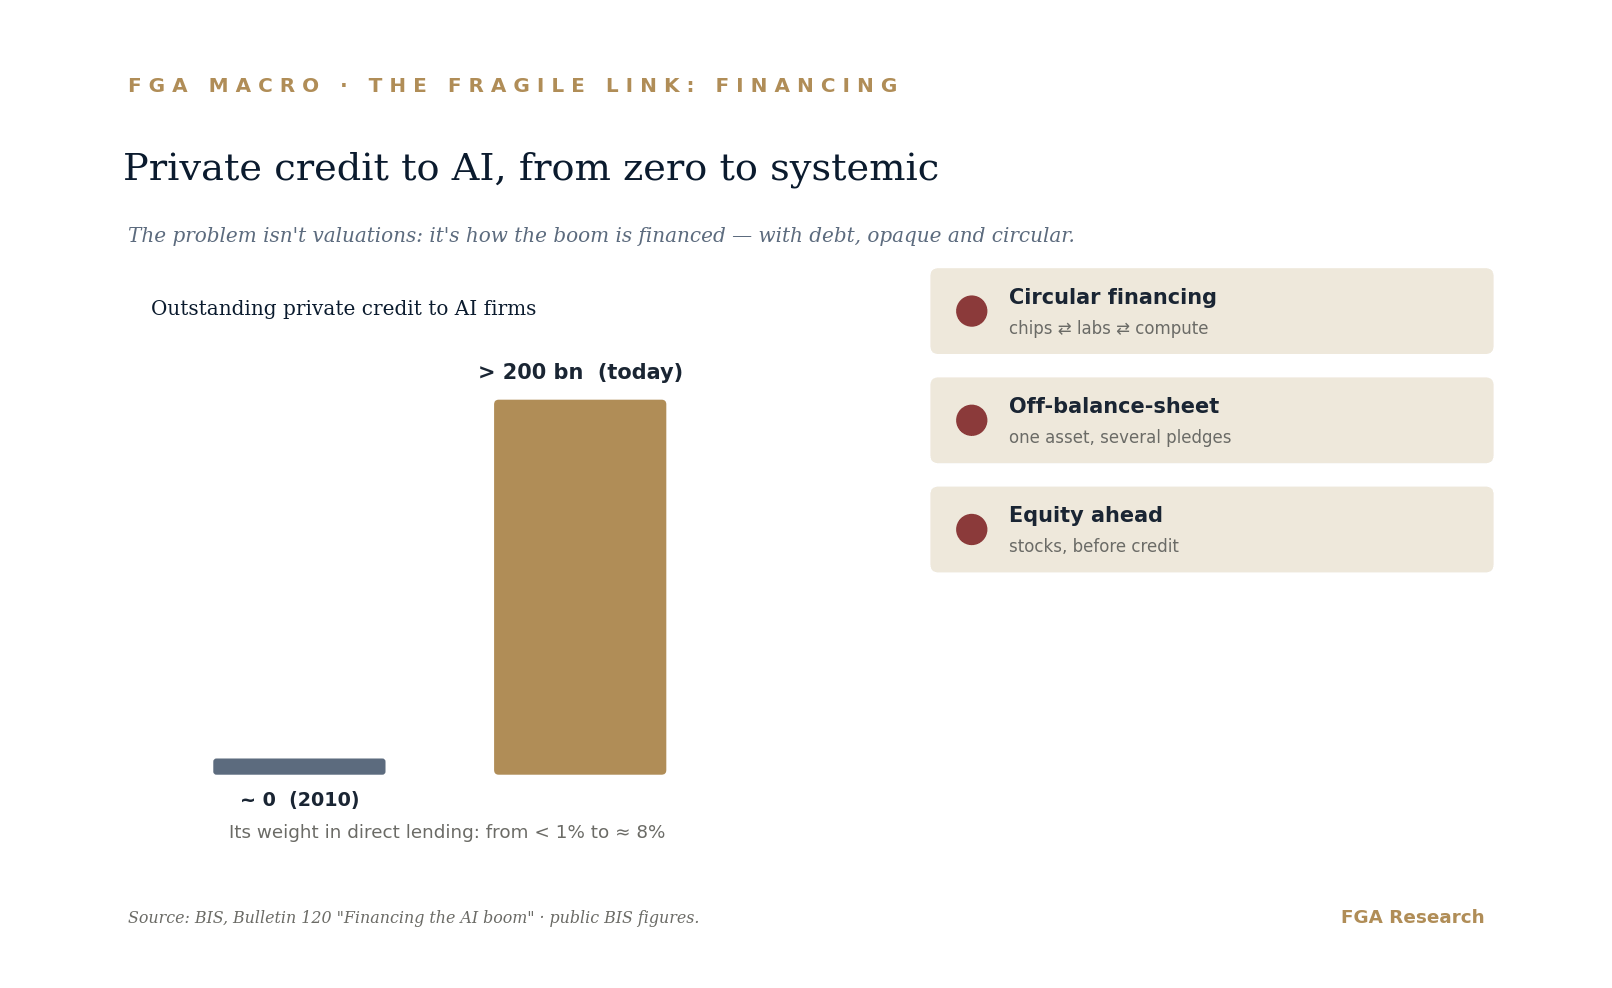
The BIS documents it. Direct lending funds have quadrupled their lending to AI and IT in five years, to about 15% of their portfolios; the outstanding private credit to AI firms already exceeds 200 billion dollars. Loans to AI are larger than average, yet with collateral, tenor and spreads similar to the rest: either lenders underprice the risk, or the equity market overvalues the cash flows.
To this add three traits that amplify any shock. Circular financing: chip makers take equity stakes in labs that, in turn, commit to buying their compute. Off-balance-sheet risk: long-dated, poorly disclosed contracts where the same asset can be pledged several times. And the wealth effect: with households more exposed to equities than ever and the US at about 64% of the global index, a US correction does not stay at home.
The BIS sums it up in a line worth keeping: "leverage does not disappear by being out of sight."
The decisive variable and the shape of the risk
It all reduces to one measurable variable: whether, in the next 12 to 24 months, aggregate productivity and AI earnings converge toward what the market already discounts, or disappoint.
What matters is the shape of the risk. If AI delivers, the cycle continues in an orderly way. If it disappoints, the adjustment is non-linear: deleveraging feeds on itself. That is why this is a tail risk, not the central case. The upside is gradual; the downside, abrupt. That asymmetry is the message.
The bull case (because it must be made too)
It would be dishonest to close only on the dark side. Unlike the dot-com, here there are real and growing revenues; the big tech firms are profitable and still fund most of it with cash. The cost of compute falls fast, which can validate the capex with less revenue than expected. Lagging productivity is not the same as absent: general-purpose technologies show a delay —the J-curve— before the aggregate jump. And the epicentre of fragility is confined to the periphery, not the profitable core.
The revolution is real. The question is not whether AI changes the world. It is whether this particular vintage of capital recovers what was invested before credit tightens.
The panel today
Translated into our framework, and publishing only the state, not the series: the cycle, out of the alert zone; the crowd, fearful despite indices at highs; liquidity, no longer easing; and our own macro, turning up. The regime that combination describes is what we call a compressed spring: energy stored under a lid. It is not the start of a crisis. It is a system under tension, held up by liquidity.
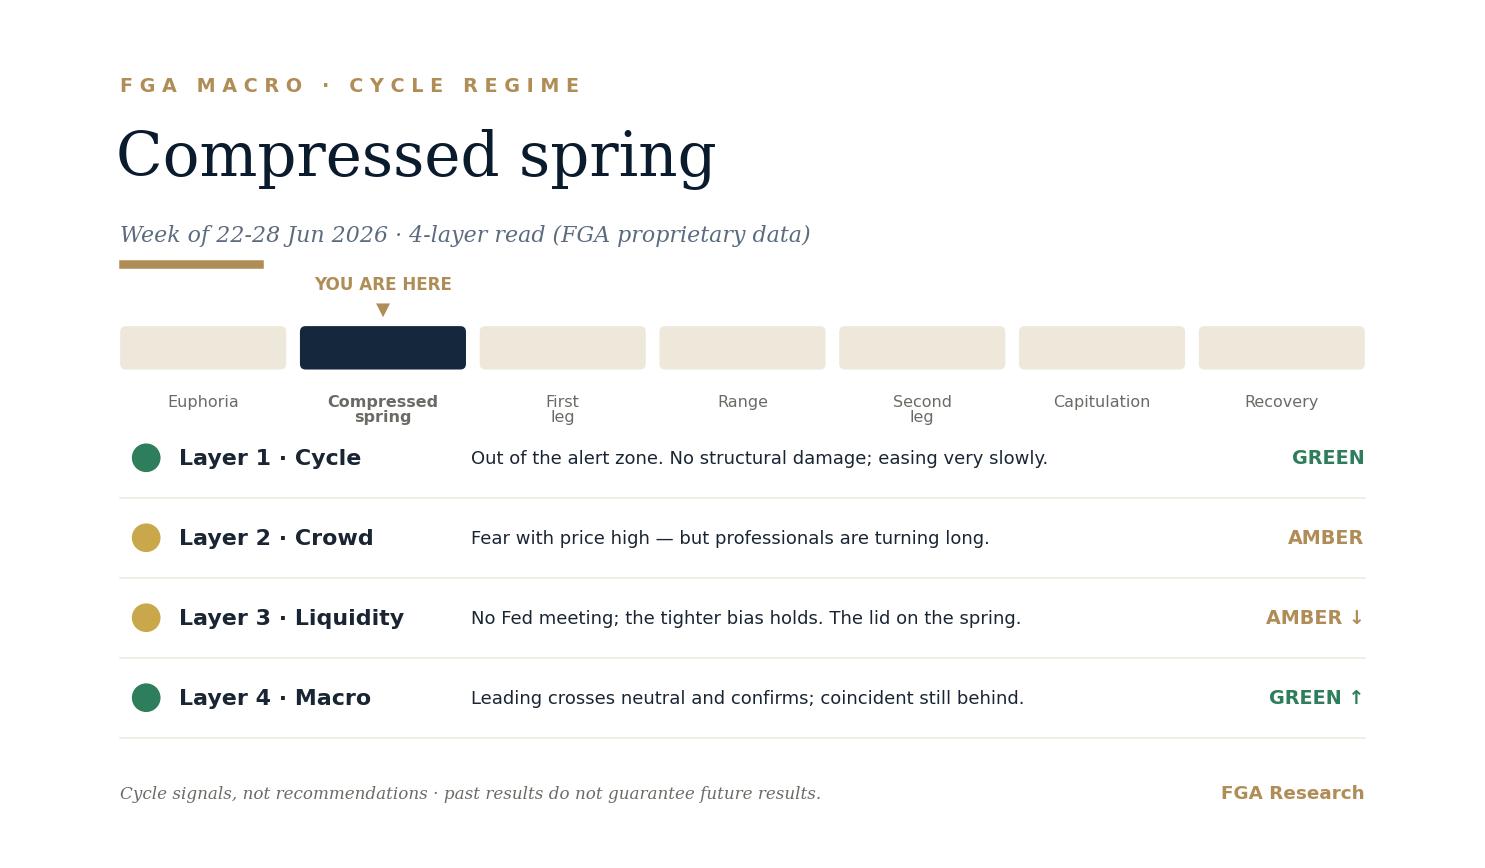
The BIS report does not change the regime. It contextualises it: it tells us where the tension to watch sits.
Signals to watch
Credit spreads of AI firms widening while stocks rise —the equity-debt divergence. (Layers 1 and 3.)
Redemptions in retail private-credit funds —early signs already. (Layer 1.)
A hyperscaler cutting its capex guidance. (Layer 4.)
Supply bottlenecks —power, chips, grid— as an amplifier of overinvestment. (Layers 3 and 4.)
None predicts the date. All move the regime. We track them every week.
Sources
BIS, Annual Economic Report 2026, Ch. I "Progress and peril" (28 Jun 2026): capex >1tn; task-level productivity 20–50% and aggregate <1% (Graph 10.A); historical parallels (Graph 11.C); circular financing and same asset pledged several times (Graph 13.C); ~15% of direct-lending portfolios (note 2); US ≈64% of the MSCI (Graph 12).
BIS, Bulletin 120 "Financing the AI boom" (7 Jan 2026): AI investment ≈1% of GDP and broad IT ≈5% (Graph 4.A); private credit >200bn and ≈8% (Graph 3.A); the leverage quote.
FGA Research, working paper (DOI 10.5281/zenodo.20709770): 33-year backtest. Results on historical data: they validate the process, not a recommendation.
Editorial content by FGA Research. It is not investment advice or a personal recommendation. It is not a recommendation on any financial instrument. References to BIS publications are provided for educational purposes; figures come from the cited sources. Past results —real or simulated— do not guarantee future results; investing carries risk, including total loss of capital. Independence. Capital. Conviction.
Reading this from an investment committee?
FGA Research distributes its institutional Macro & Markets report on demand and subject to prior qualification: the same four-layer process, with the full proprietary series and watchlist. If you allocate capital, manage risk or set strategy for a committee, write to us stating your role and mandate. We confirm eligibility and send the full report within 24h.