

In one sentence. The July employment report does not say companies are letting people go: it says they have stopped hiring. The two look alike in a headline and behave very differently in a cycle. It touches Layer 4, the Macro, and does not move it: the labour market own leading indicator sits at its best level since 2022. The regime remains Compressed Spring.
Start with the contradiction, because it resolves itself
On Friday 7 August, the US Bureau of Labor Statistics published two sentences that look incompatible.
The first: the economy lost 23,000 jobs in July. The second: the unemployment rate fell, from 4.2% to 4.1%.
How do you lose jobs and see unemployment fall at the same time?
Because these are two different surveys measuring different things. And because, above all, the unemployment rate only counts people who are actively looking for work. If someone stops looking, they leave both the numerator and the denominator: unemployment falls without anyone finding a job.
That is exactly what happened. The participation rate — the share of the population working or looking for work — fell to 61.4%. It is down 0.7 points since January. The employment-to-population ratio also fell, to 58.9%.
In plain terms: unemployment did not fall because jobs were created. It fell because fewer people are looking for them.
The three numbers that actually matter
Beyond the headline, three concrete things.
One: the revisions. May and June were revised down. May went from +129,000 to +63,000. June, from +57,000 to +20,000. Between them, 103,000 jobs that had been counted and are no longer there. The average over the prior twelve months was +34,000 a month; July came in at −23,000.
Two: where the losses are. Local government education (−50,000), retail trade (−19,000) and financial activities (−14,000, now 121,000 below their May 2025 peak). Health care is still adding jobs (+22,000), but more slowly than its twelve-month average (+36,000).
Three: temporary layoffs. They rose by 153,000, to 921,000. Permanent job losers barely moved. That is the difference between sending people home for a while and closing the position.
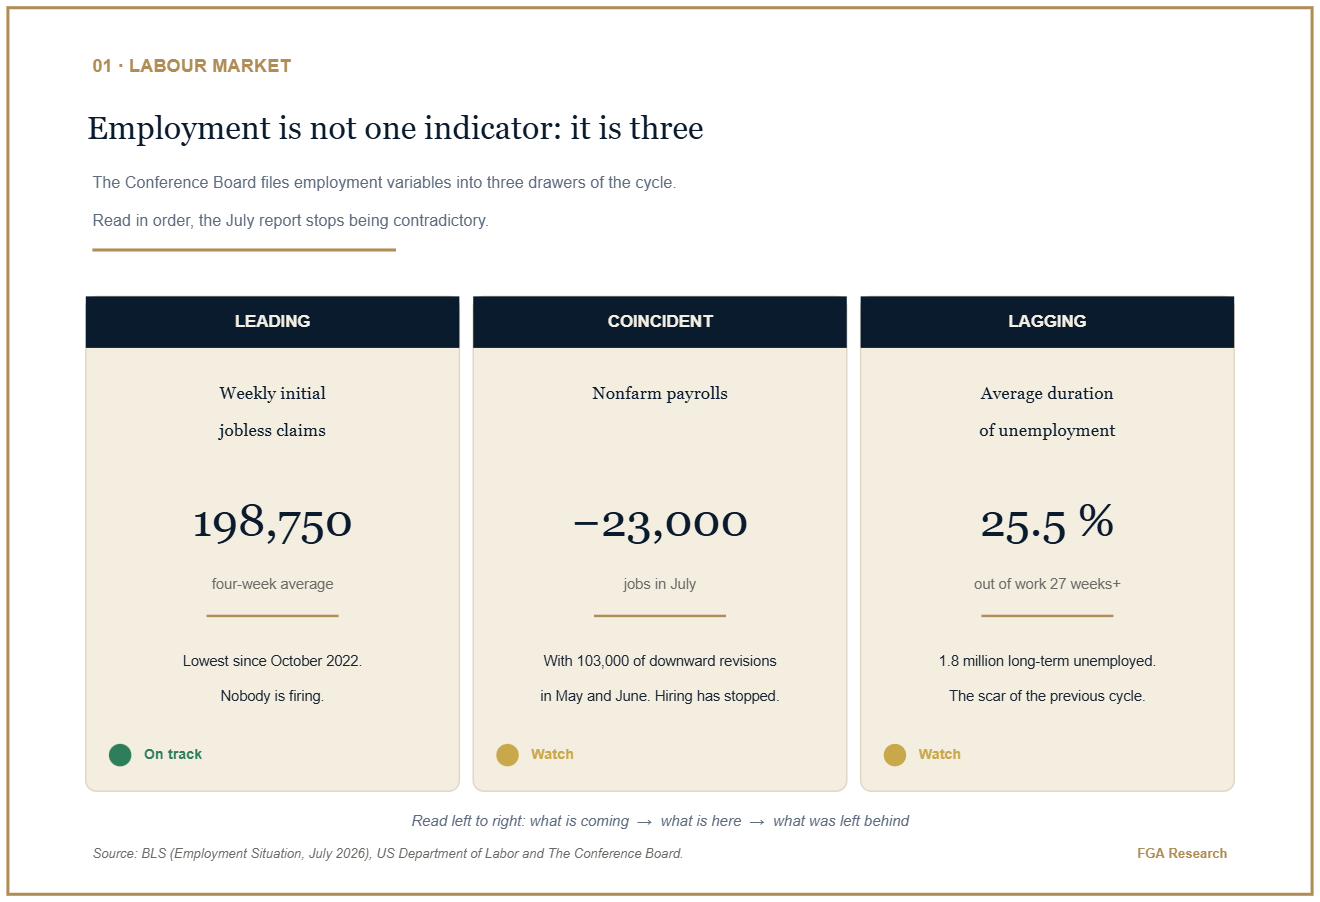
The same labour market, measured at three different points of the cycle. Source: BLS, US Department of Labor and The Conference Board · FGA Research illustration.
In 30 seconds
Regime: Compressed Spring — no change. This report does not change the colour of any layer.
Layer 1 · Warning — 🟢↑ no direct link. A labour market cooling through hiring rather than firing does not close any vicious circle.
Layer 2 · Crowd — 🟡 US retail investors raised their bullishness to 37.0% in the AAII survey of 6 August, which closed the day before the data. Sentiment ran ahead and has not digested it yet.
Layer 3 · Money (the Fed) — 🟡 here there is a consequence: a labour market that cools without breaking is the argument of the wing that does not want to raise rates. The next real date is Jackson Hole, 27–29 August — Kevin Warsh first as Fed Chair.
Layer 4 · FGA Macro — 🟢↑ the layer this touches, and it does not move: the leading indicator of employment is at its best level since October 2022. It is the coincident one that has stalled.
The so-what: employment is the worst place to look for the future and the best place to confirm the past. When the leading measure says no layoffs and the coincident one says no hiring, what you have is an economy cooling without breaking. That is not a recession starting; it is a cycle losing momentum. Telling the two apart is half the job.
This is how we read the cycle every week: four layers, made clear. Get it free in your inbox.
Why employment always arrives late
This is the part that is rarely explained, and it is what gives the data its value.
Put yourself in the shoes of someone running a company and it becomes clear in a minute. Sales start to soften. What do you do in month one? Nothing. You wait. Month two? You stop replacing leavers: you do not fire anyone, you simply do not backfill. Month three? You cut overtime. And only when there is no alternative left do you make redundancies.
Quarters can pass between an economy cooling and that cooling showing up in the unemployment data. Which is why employment, as a cycle thermometer, always arrives late.
And this is not our opinion: it is in the official accounting of the cycle. The Conference Board, which has built the reference indices for decades, files employment variables into three separate drawers:
Leading — weekly initial jobless claims. They measure layoffs in close to real time. Four-week average: 198,750. Below 200,000 for the first time since October 2022.
Coincident — nonfarm payrolls. They measure the jobs that already exist. July: −23,000, with 103,000 of downward revisions across the two prior months.
Lagging — average duration of unemployment. It measures the scar of the previous cycle. 1.8 million people have been out of work for 27 weeks or more: 25.5% of all unemployed.
Read it top to bottom and the report stops being contradictory: nobody is firing (leading indicator at its best in almost four years), hiring has stopped (coincident stalled), and those already out find it hard to get back in (lagging still tight).
That is the natural order of a cycle decelerating. Not of one breaking. When it breaks, the first drawer is the one that jumps — and that is precisely the one in the best shape today.
The detail almost nobody has reported: the surveys say the opposite
Four days before the employment data, another number came out, pointing the other way.
The ISM manufacturing index — the monthly survey of industrial purchasing managers, one of the longest-running leading indicators there is — printed 55.6 in July, its highest since May 2022. Above 50 means expansion. Its employment component rose to 52.8, entering growth territory for the first time in 33 months. Sixty percent of respondents said their company is hiring.
And the ISM services index, published two days later, said the exact opposite in its employment component: 47.4, back into contraction after a single month in positive territory.
Three measures of the same month. One says industry is hiring again. Another says services have stopped. The third — actual payrolls — says the net balance is negative, and that the hole is in local government and retail.
This is not a data failure. It is a two-speed economy: the part that manufactures is recovering; the part that employs the most people is stalling.
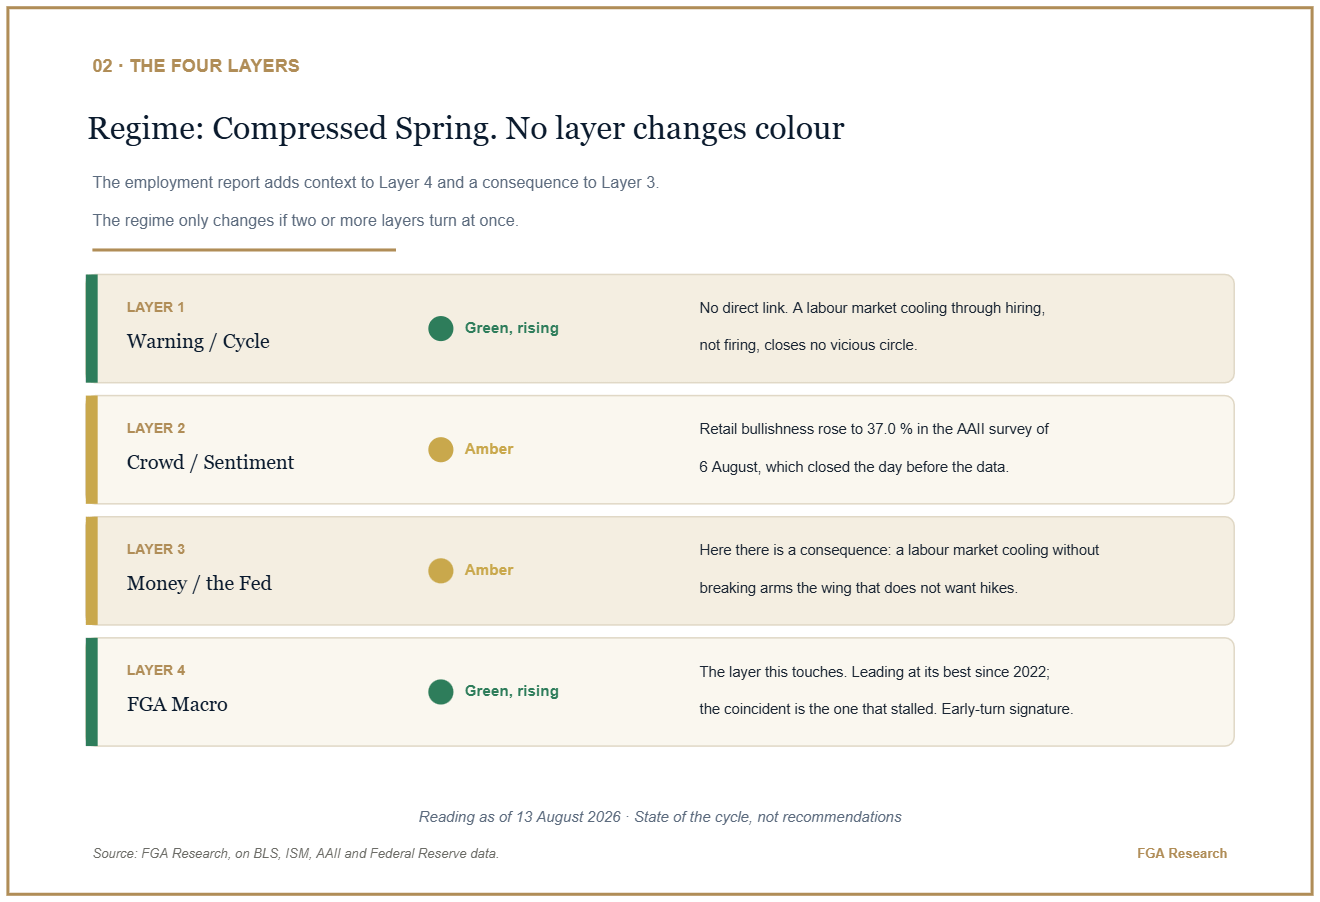
Reading of the four layers as of 13 August 2026. The report adds context to Layer 4; it does not move it. Source: FGA Research.
And the rule everyone quotes: today it says nothing
Every time a weak employment print lands, the Sahm rule appears. It is worth understanding, because it is simple and because today it settles the debate.
The rule says: if the three-month average of the unemployment rate rises half a point or more above its low of the previous year, historically a recession had already begun. It does not predict: it dates. It confirms that something already underway was indeed underway.
With the July data, the reading is −0.03. The threshold is +0.50. It is not close: it is on the other side, and falling.
Here honesty about the caveat matters, because it is what separates a useful reading from a reassuring headline: the rule looks at the unemployment rate, and the unemployment rate fell this month for the wrong reason — people who stopped looking, not people who found work. Any indicator built on that rate inherits that blind spot. Which is why we never read a layer off a single number.
How we read it
Our Layer 4 systematically compares leading against coincident. That comparison is what produces the phase signature, and it works in both directions:
Leading up + coincident down → an early turn, the economy is changing feet.
Leading down + coincident up → the end of an expansion: the good number of today is the momentum of yesterday.
The July report fits the first. And it fits what we have been reading for two weeks: our own coincident measure posted its largest jump in a year in the raw monthly data, while the lagging measure sank to its low for the year. Local government and retail subtract; real activity adds.
The obligatory caution, stated just as plainly: the classic leading index does not fully agree. The Conference Board index fell 0.2% in June, to 99.1, unwinding part of the prior two months of gains. Its July reading is published on 20 August. If it falls again with the ISM at four-year highs, we will have a divergence that needs explaining — and we will explain it.
Layer 4 stays green today. The report does not change the colour of any layer. It changes where we look inside it.
What does NOT change
The regime remains Compressed Spring, and it will remain so until two or more layers turn at once.
And there is a discipline here that is hard to hold. A headline reading US economy destroys jobs triggers a physical urge to do something. The method exists precisely for that: to separate what is already happening from what would have to happen for the diagnosis to change.
What would have to happen here is concrete and watchable: weekly jobless claims would have to start rising in earnest. That is the leading drawer. Today it is at its best level since 2022. While it stays there, a month of negative payrolls is a cycle cooling, not one breaking.
What to watch — three specific dates
This piece does not close today. It closes over the next three readings, and all three have a date:
19 August — FOMC minutes. On 29 July the Fed held rates at 3.50–3.75% with three votes to raise them, the largest dissent in a single direction since 2016. The minutes will show whether that hawkish wing was already factoring in a cooling labour market.
20 August — Conference Board Leading Economic Index. If it falls again while the ISM rises, the divergence between surveys and hard data stops being anecdotal.
28 August — the BLS benchmark revision. Once a year, payrolls are checked against the actual tax records of nearly every employer. That day brings the preliminary estimate of how much had been over- or under-counted. In recent years that correction has been large. It is by far the most important employment number of the month — and almost nobody has it in the calendar.
All three fall in the same two-week block. And the third lands on the opening day of Jackson Hole.
A report gives you the photograph; the follow-up gives you the film. In a labour market cooling through the hiring channel, the only thing that really matters is whether the cooling moves from the coincident drawer to the leading one. You cannot see that in one data point: you see it in the sequence.
And you — which layer are you watching this week: the Warning, the Crowd, the Money or the Macro? Drop it in the comments; I read them all.
Editorial and educational content, not investment advice. No buy or sell signals and no price targets. Past results — real or simulated — do not guarantee future results; investing involves risk, including the total loss of capital.
Why we read employment the way we do
On the cycle, we publish the record. The four-layer framework is documented in a working paper with a DOI (WP-2026-01, DOI 10.5281/zenodo.20709770), and the results are stated in full: 6 of 6 episodes ahead of the break (exact binomial p ≈ 0.016) — defensive before 2000, 2008, 2020 and 2022, with no false exit in 1998 or in the fourth quarter of 2018. In production since 2007–2008, with no reoptimisation over the episodes being judged. And a pre-registered public forward test on OSF: every regime change is timestamped live, before the outcome is known.
We say it for one specific reason: anyone can claim an employment print changes nothing. That claim is worth exactly what the track record of the person making it is worth. Ours is open, dated and checkable — failures included.
Reading this from an investment committee or from the top of a company?
We produce the Institutional Macro and Markets Report on request and subject to qualification: the same four-layer process, with the full proprietary series and the watchlist. Write to us stating your role and your mandate; we reply within 24 hours.
Information, not advice. Independence. Capital. Conviction.
Independence. Capital. Conviction. · FGA Research and Advisory · Est. 2006 · 33 years of study
Sources
U.S. Bureau of Labor Statistics, The Employment Situation — July 2026, USDL-26-1291, 7 August 2026 — bls.gov
U.S. Department of Labor, Unemployment Insurance Weekly Claims, week ending 1 August 2026 — dol.gov
Institute for Supply Management, July 2026 Manufacturing and Services PMI reports — ismworld.org
The Conference Board, US Leading Economic Index and component descriptions — conference-board.org
Federal Reserve Bank of St. Louis (FRED), Sahm Rule Recession Indicator (SAHMCURRENT), July 2026 — fred.stlouisfed.org
Federal Reserve, FOMC statement of 29 July 2026 — federalreserve.gov
AAII Investor Sentiment Survey, 6 August 2026 — aaii.com
FGA method and working paper WP-2026-01 — DOI 10.5281/zenodo.20709770